Now enrolling, the ₹999 intro session is open. See all courses ·Read the prospectus
Enrol now WhatsApp
Duration2 Weeks
Sessions4 live, 2 hours each
BatchMax 20
Fee₹5,000
Who it is for

Is this for you?

  • Head brewers and owners whose numbers live in five spreadsheets and a WhatsApp group
  • Analysts at beer companies who have the tools but not the brewing context
  • Graduates of Digital Transformation Basics ready for a proper dashboard
By the end

What you walk away with.

  • Turn brew logs, stock sheets and sales exports into one clean data model
  • Build a yield, loss and quality dashboard in Power BI and the same one in Tableau
  • Know which tool fits your brewery, your budget and your IT setup
  • Leave with a weekly dashboard your team opens without being asked
Your instructor

Who teaches this course.

Course Instructor · Master Brewer

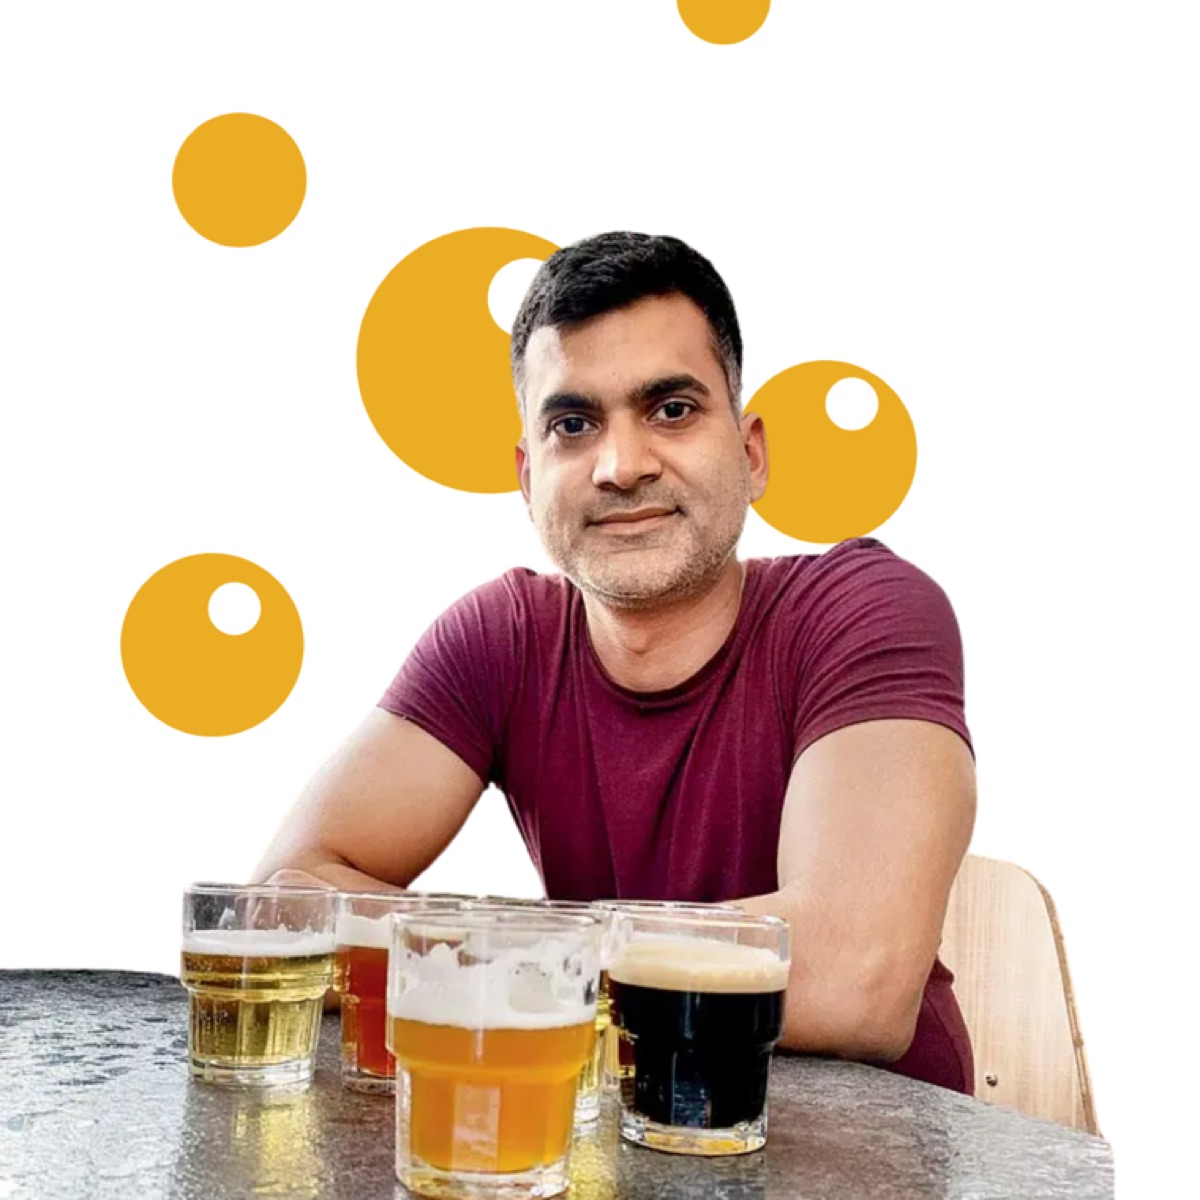
Ankur Napa

A Master Brewer from R&D at United Breweries, SABMiller and AB InBev who went on to build AI and GenAI as a data scientist for AB InBev's global business units.

Syllabus

Week by week.

2 weeks. Two live sessions every weekend and one assignment a week.

Week 01. The brewery data model
  • What a dashboard needs from the floor: batch codes, dates, volumes, gravities, losses
  • Cleaning the brew log: one row per batch, one unit per column, no merged cells
  • Joining brew, cellar, packaging and sales data on the batch code
  • Power BI: Power Query, the data model and your first DAX measure
  • Tableau: connecting, joining and your first calculated field
  • Brewhouse yield, beer loss and tank occupancy as measures, with the formulas

Assignment: Load last quarter's brew log into Power BI or Tableau and get yield per batch on screen.

Week 02. Dashboards people open
  • One page, five numbers: volume, yield, loss, days in tank, what sold
  • Fermentation curves and quality trends with control limits
  • Sales and depletions next to production, so stock stops surprising you
  • Power BI versus Tableau: licensing, sharing, refresh and where each one hurts
  • Refreshing the data without a person retyping it every Monday
  • The habit: a weekly ten-minute review, and what to do when a number moves

Assignment: Build your weekly brewery dashboard in the tool you chose and present it to the cohort.

How it runs

Format and terms.

Schedule
Live on Saturdays and Sundays, 12:00 PM to 2:00 PM IST. Timings may shift by mutual agreement with the cohort.
Batch size
Maximum 20 students, so every question gets answered.
Included
Session recordings, presentation decks, weekly assignments and the learning kit.
Certificate
Certificate of Completion once every assignment is in and you have attended at least 80% of live sessions.
Beyond the screen
Recommended microbrewery visits, so you see the kit you are studying.
Fees
Paid in full at sign-up. No discounts apply, and a package of courses cannot be changed once confirmed.

Want the full flight? All eighteen courses together run to 53 weeks, and you choose your package when you enrol. Compare all eighteen courses, and read the refund policy before you pay.
Save your seat in Power BI and Tableau for Breweries.

Cohorts cap at 20. Enrol now or ask us on WhatsApp.